DeltaBlue
Uptime reporting
x min read
To help you investigate why an url went offline we offer a detailed history screen providing you with a lot of insights about the history of your url.
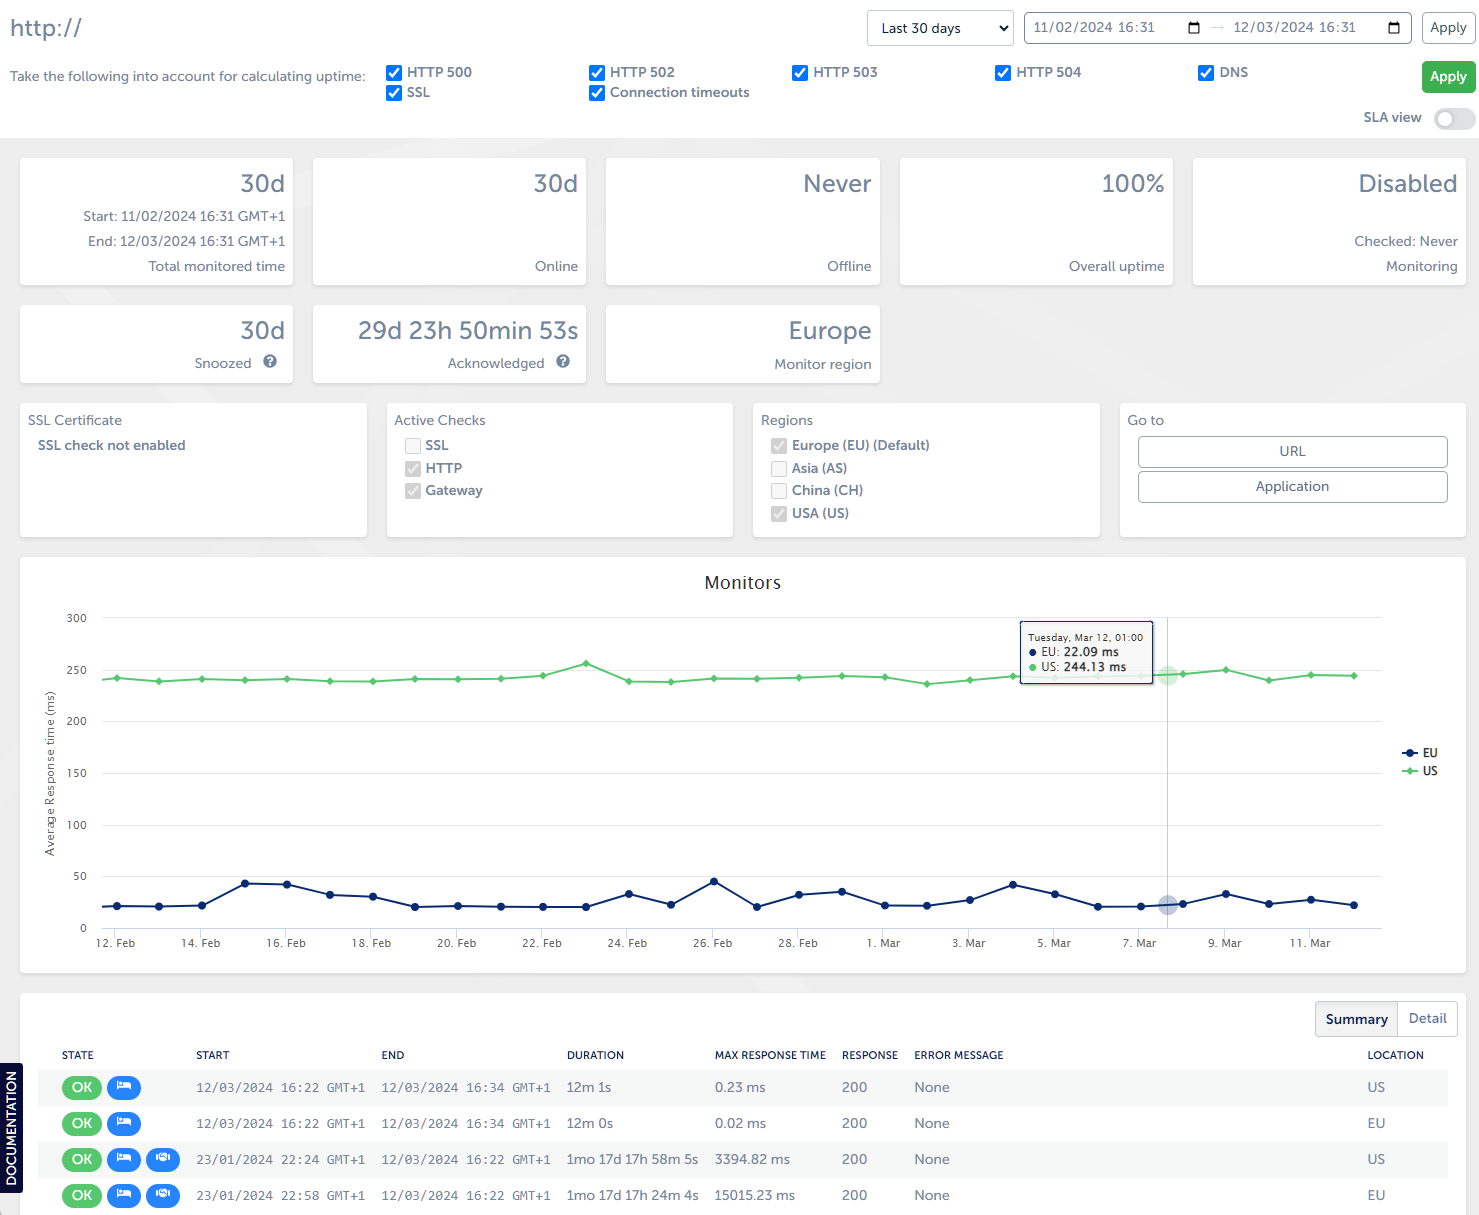
Understanding Error Codes and SLA Reporting
In the availability monitor, we provide insights into the uptime and availability of URLs. To give you a clear understanding of the status and potential issues, we distinguish between different error codes. It's important to note that these codes help determine whether an issue is related to infrastructure or application problems. This distinction is crucial, especially when calculating Service Level Agreements (SLAs).
Error Codes Explained
HTTP 500 - Internal Server Error
This error typically indicates an issue on the application side. It is not considered for SLA calculations as it is often related to application logic problems rather than infrastructure.
HTTP 502 - Bad Gateway
Like HTTP 500, this error is usually application-related and does not impact SLA calculations.
HTTP 503 - Service Unavailable
A HTTP 503 error, also known as "Service Unavailable," indicates that a web server is temporarily unable to handle the request. This error can occur for various reasons, and the specific services or components that may become unavailable can vary. It's important to note that the exact cause of a HTTP 503 error should be investigated to identify and resolve the underlying issue. In the SLA view, HTTP 503 errors are counted for SLA calculations.
HTTP 504 - Gateway Timeout
Similar to HTTP 502, this error is generally application-related and doesn't affect SLA calculations.
DNS (Domain Name System) Errors
DNS errors indicate issues with domain resolution. These are not considered for SLA calculations as they relate to DNS configuration rather than infrastructure.
SSL (Secure Sockets Layer) Errors
SSL errors pertain to security certificates and encryption. They are not included in SLA calculations.
Connection Timeouts
Connection timeouts can be infrastructure or network-related. In the SLA view, connection timeouts are counted for SLA calculations.
Using the SLA View
On the history screen of an URL you have the option to turn on the SLA view.
SLA view ON
This mode is designed for SLA reporting. It takes into account only HTTP 69 errors and connection timeouts. These errors are considered infrastructure-related. However, it's important to note that even these checks may require further investigation, as occasionally, application issues can manifest as HTTP 69 errors or connection timeouts.
SLA view OFF
When SLA view is turned off, you gain the flexibility to tailor the error reporting to your specific needs. Unlike the SLA view, which focuses on specific errors, this view allows you to decide which errors you want to include in the reporting.
Download availability reports
Get easy-to-read and easy-to-share insights into availability by downloading availability reports.
Useful in communication to stakeholders.
An availability report contains the following:
- Uptime summary for each region where the application was deployed
- A breakdown of all monitoring events
Follow these steps to generate an availability report:
- Choose a time range to generate a report for
- Choose the checks that will be considered as being "down"
- Click the "Availability report" download button
A report based on your chosen parameters will be downloaded.