
Resource usage overview
In the resource usage overview you can view “resource events,” which occur when an application consumes 85% or more of its reserved capacity in terms of memory, CPU, or disk space.
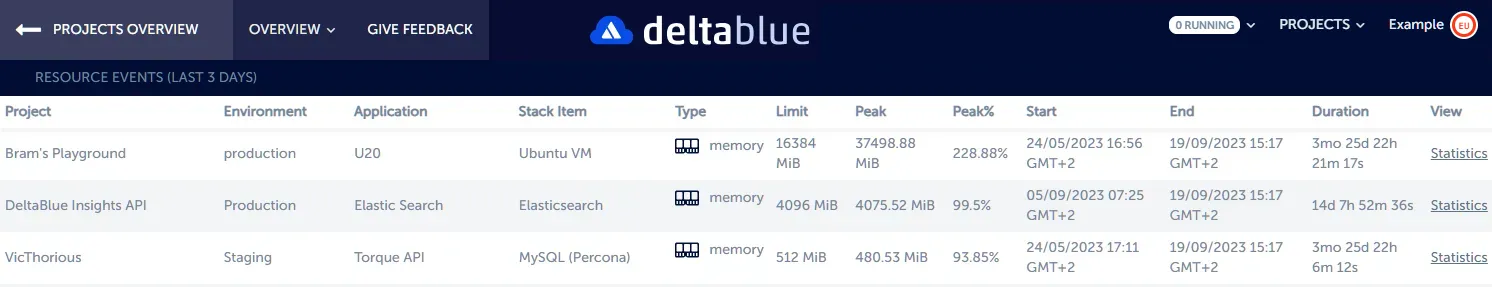
This screen provides a comprehensive summary of all resource events from the past 72 hours, enabling you to quickly monitor whether an application’s workload became excessively high. This serves as a valuable indicator, encouraging further exploration into the precise events that occurred. We’ve streamlined this in-depth investigation process by offering direct access to our detailed statistics. You can delve as far back in time as you prefer, making it effortless to identify patterns, such as occasional resource spikes due to security updates.
Advantages
-
Real-time Resource Monitoring: Our Resource Events Overview screen provides you with a real-time summary of all resource events from the past 72 hours. This enables you to swiftly identify instances where an application’s load exceeded expectations.
-
Easy Investigation: When you notice a resource event, diving deeper into the issue is a breeze. We offer direct links to detailed statistics, allowing you to explore resource consumption trends. For example, you might discover recurring spikes in resource usage.
-
Proactive Cost Management: By identifying resource events promptly, you can take proactive steps to optimize your costs. You’re in control, whether it involves adjusting resource allocations or fine-tuning your applications.
-
Improved Performance: Keeping resource usage in check ensures your applications run smoothly, even during unexpected traffic surges or growth periods.