Monitoring application performance and usage
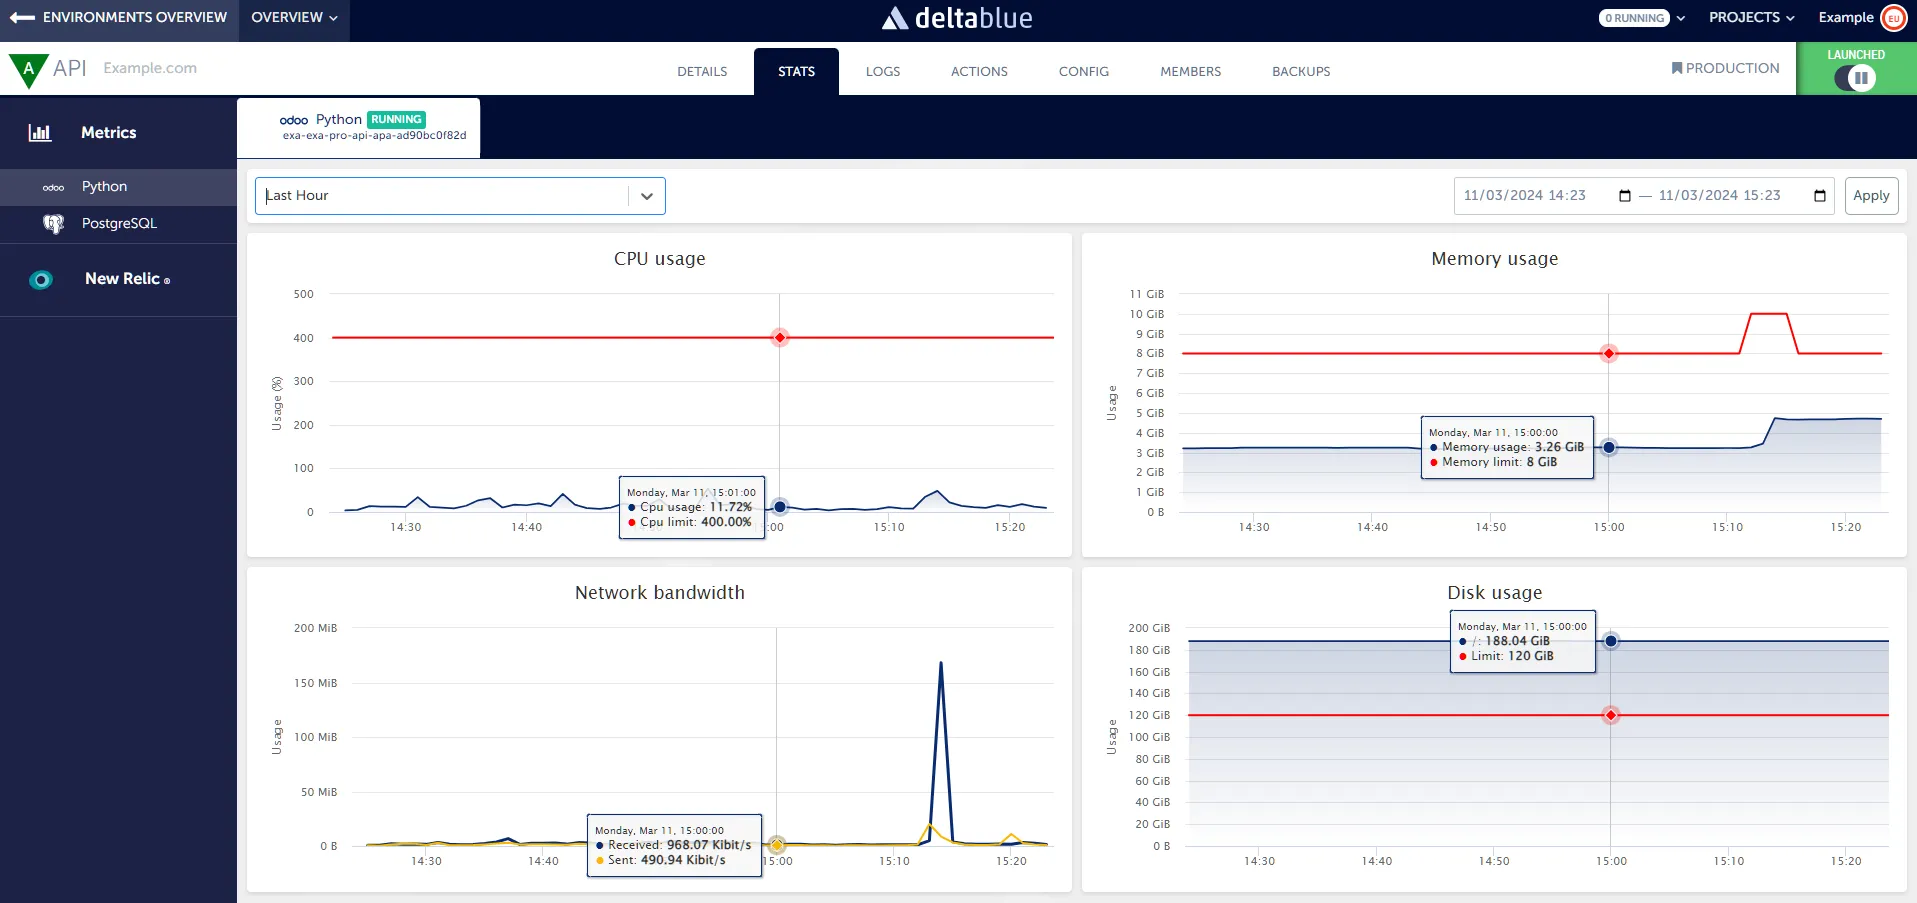
In the DeltaBlue Cloud Platform, you can efficiently monitor metrics for the stack items within their applications through the Stats page. This feature provides users with detailed insights into CPU usage, memory usage, disk usage, and network bandwidth, enabling performance monitoring and troubleshooting. Here’s how you can utilize this functionality:
Accessing the Stats Page
- Navigate to the Stats page within your application’s interface. Here, you’ll find an overview of metrics for the stack items within your app.
Monitoring Metrics
- In the Stats page, you can monitor various metrics, including CPU usage, memory usage, disk usage, and network bandwidth. This provides valuable insights into the performance and resource utilization of your stack items.
Selecting Date Range
- You have the option to select a predefined date range or choose custom “from” and “to” dates to view metrics for specific time periods allowing you to investigate issues such as usage spikes or slow performance caused by running jobs.
Managing Resource Limits
- You can also view the resource limits within the Stats page, ensuring that sufficient resources are available for optimal performance. If necessary, you can upgrade resources to meet demand or downgrade for cost optimization.