DeltaBlue
Enabling New Relic
x min read

Overview
The New Relic integration allows you to seamlessly enable New Relic data ingest for supported components. This integration provides Application Performance Monitoring (APM) capabilities, offering you valuable insights into the behavior and performance of your applications. This makes it easier for you to detect where performance optimisations have the greatest impact.
Enabling New Relic
To enable the New Relic and access its features, follow these steps:
-
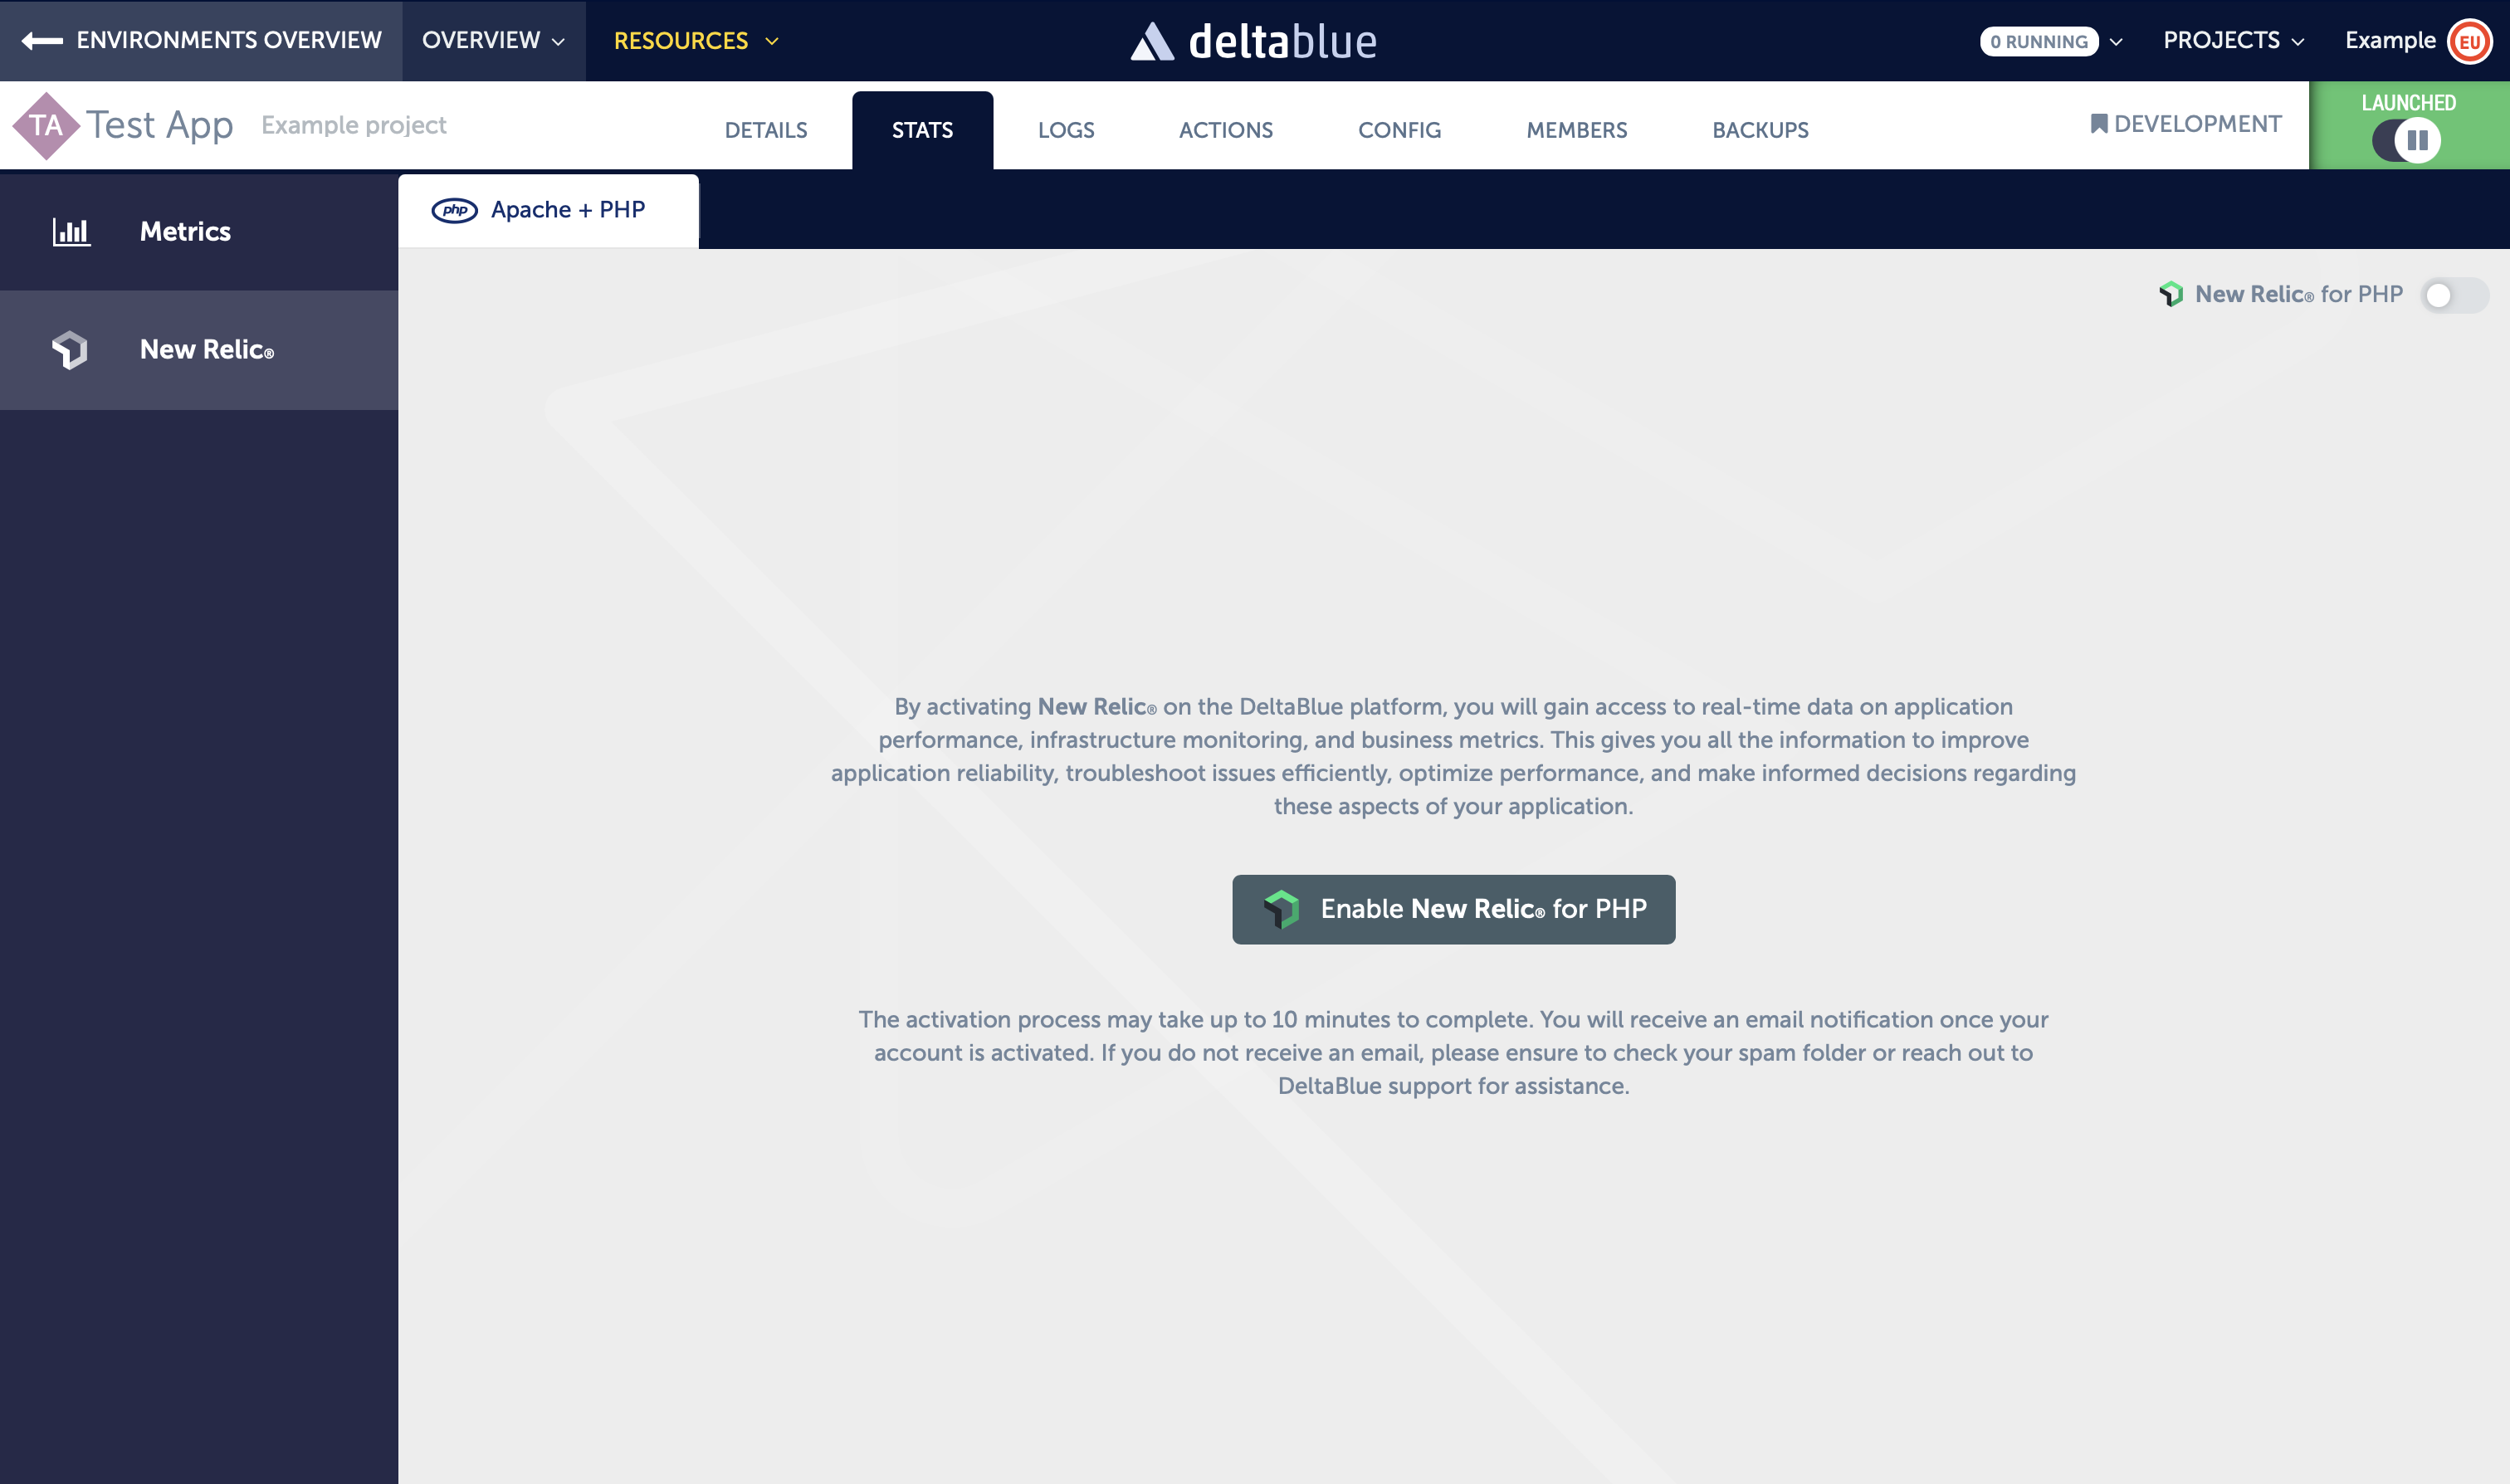
Navigate to the stats section of your application.
-
Click the "New Relic" tab on the left.
-
Click on "Enable New Relic …" to initiate the integration process. This can take up to 15 minutes before the New Relic side has finished its setup.
- Once the integration is successfully configured, you will see statistics:
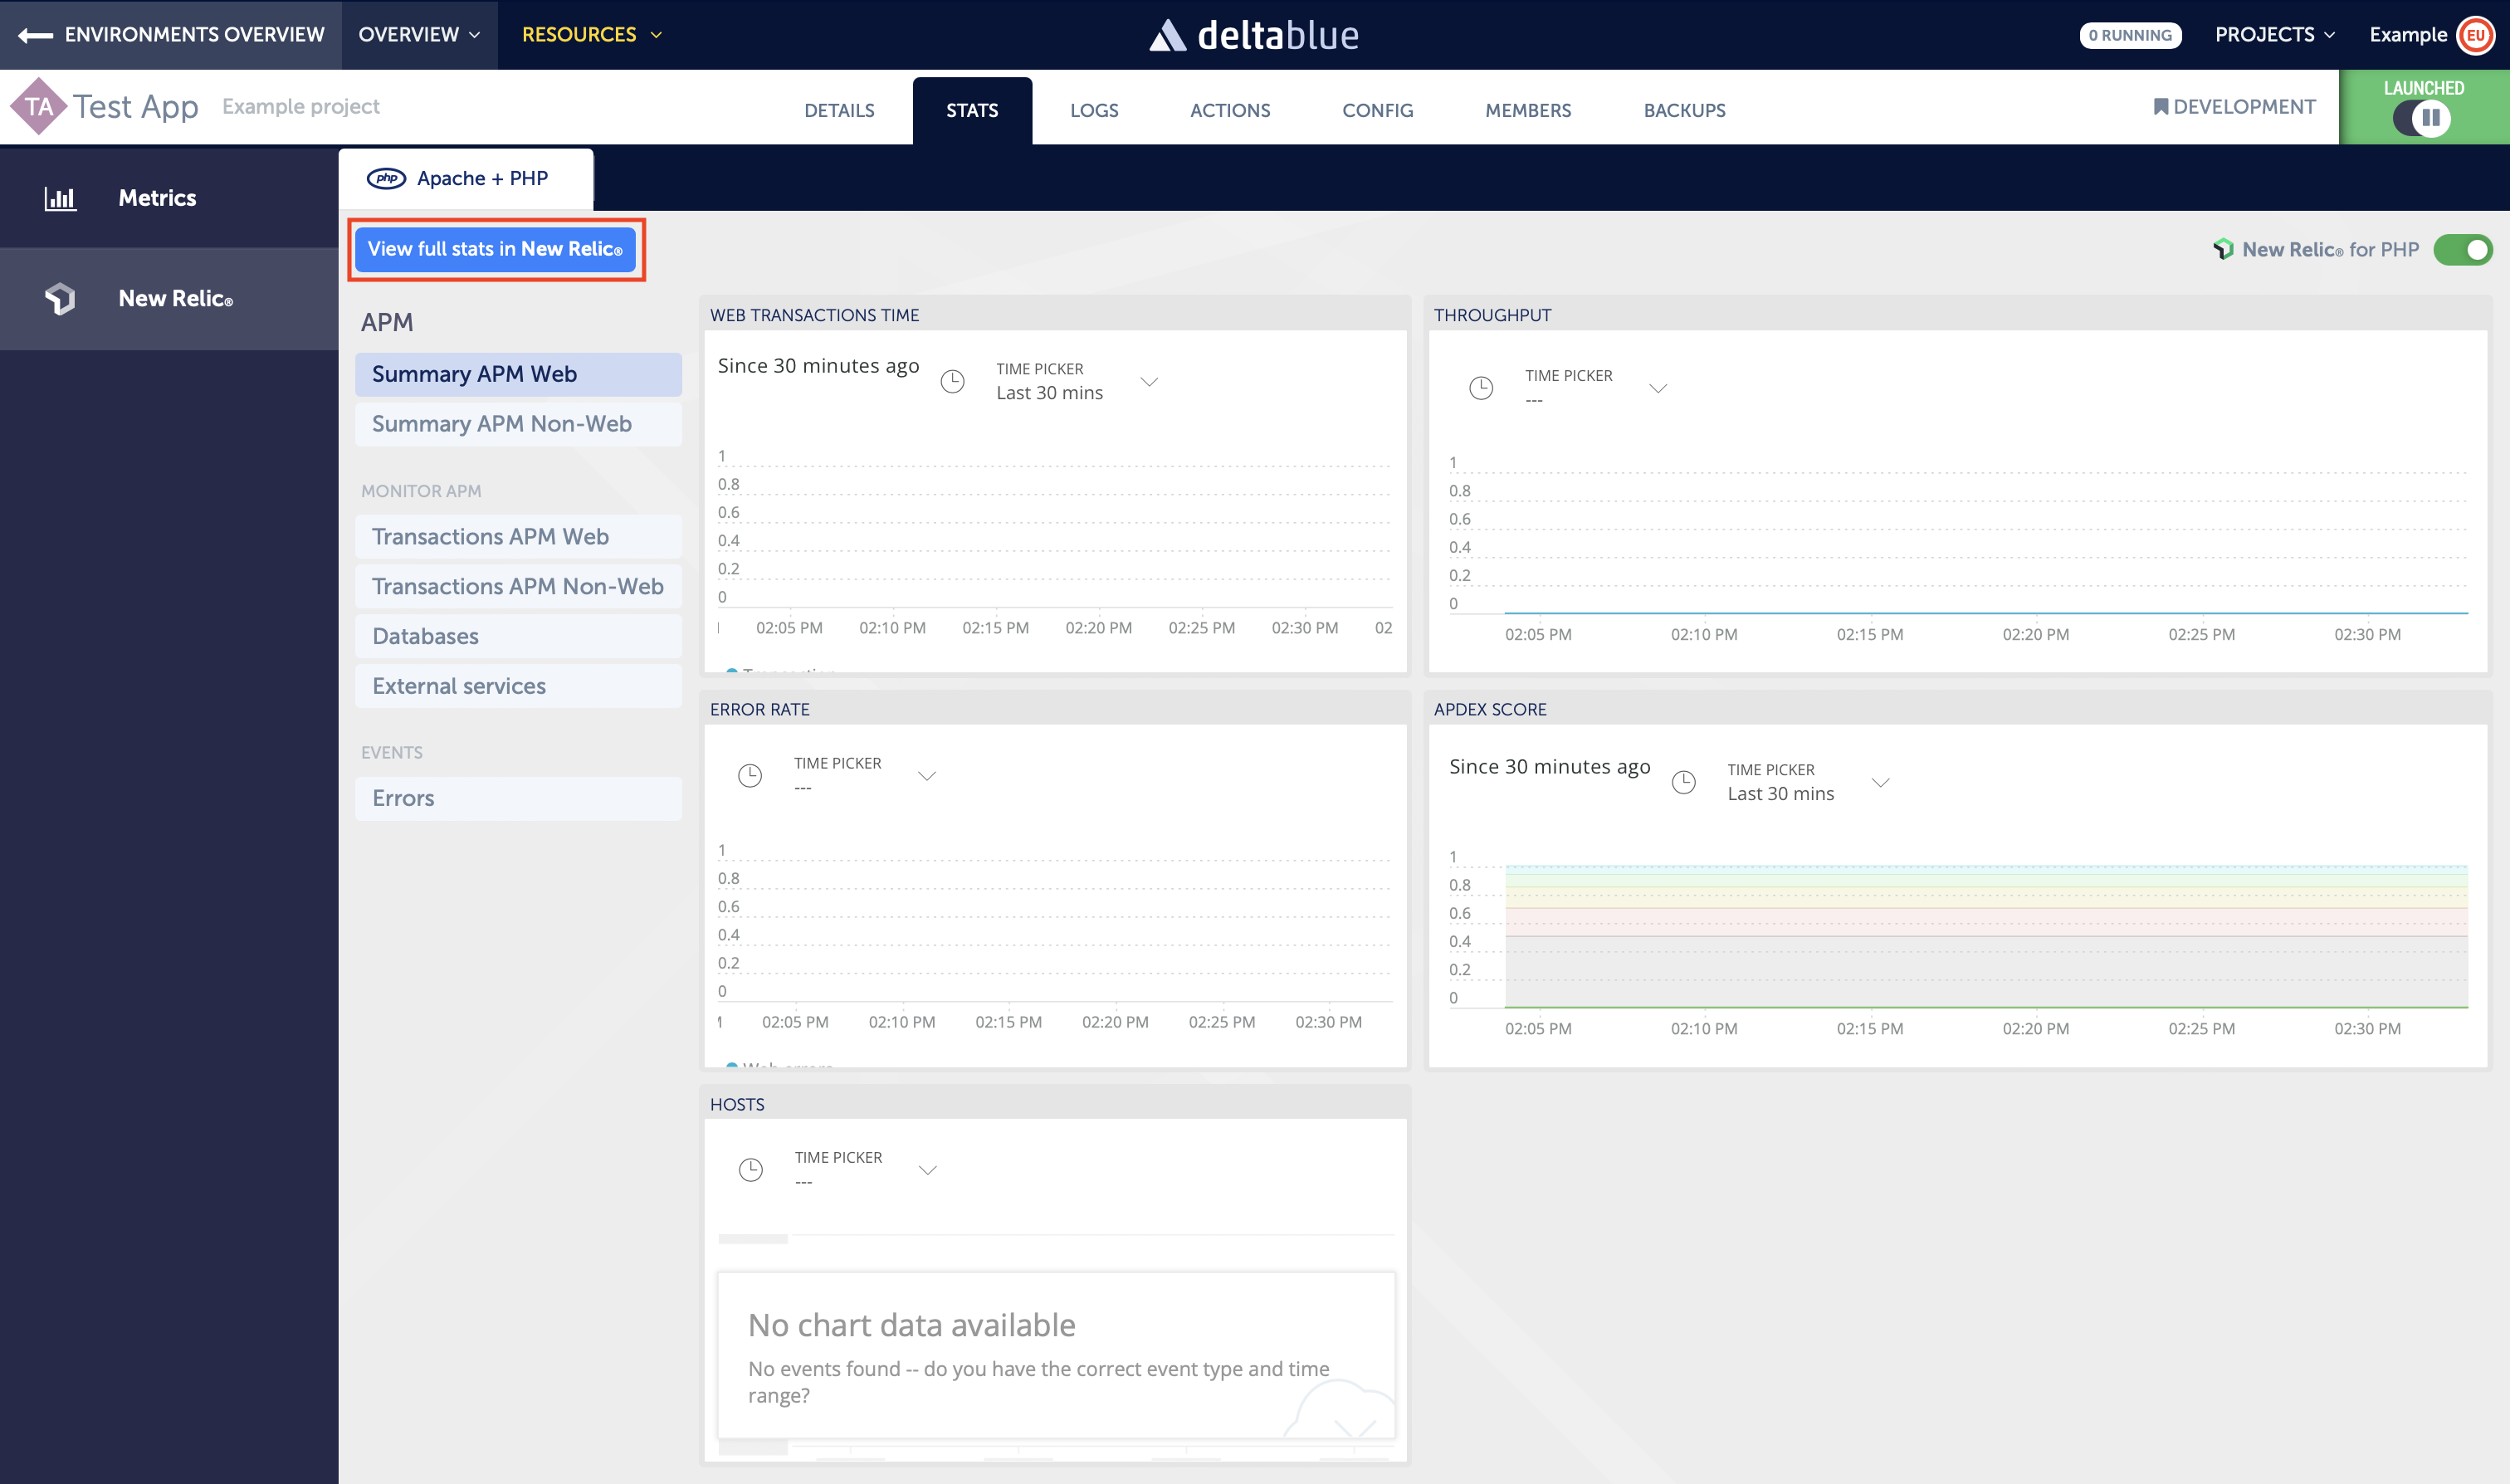
Note that they will initially be empty, but as soon as data is being collected, it will show up here. The embedded graphs give you a quick insight at first glance, but in order to get the benefit from the full potential, you will need to log in to the New Relic UI.
Using the New Relic UI
All users in your team will have received an e-mail to activate their New Relic account, unless they already had an active account.
This will allow you and your team members to log in to one.newrelic.com to use the rich feature set of the New Relic UI.
Use the "View full stats in New Relic" button in the top left of the interface to quickly go to the New Relic platform.
Once logged in, navigate to the APM section:
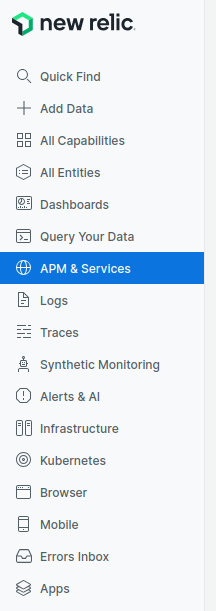
You should then find a list of your applications. Pick one and start exploring!
For more information, be sure to visit docs.newrelic.com. The APM page is a good place to start.