DeltaBlue
Realtime statistics of your environment
x min read
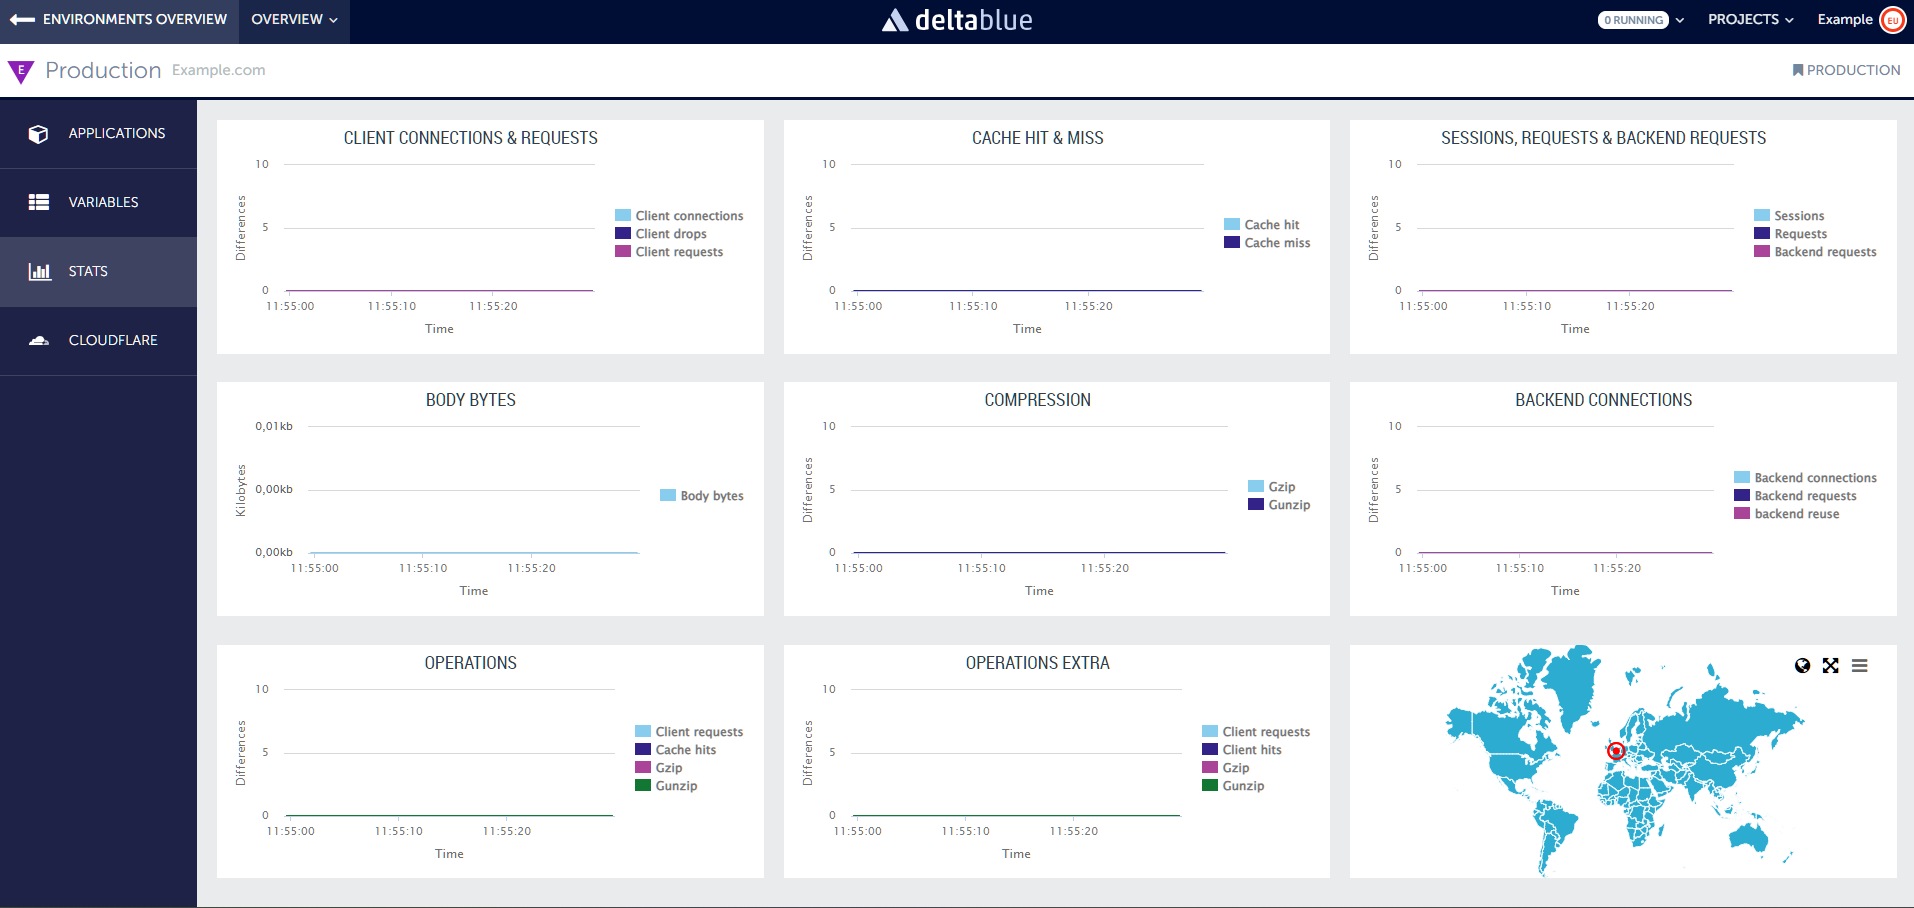
Within our platform, the STATS tab in your environment provides you with invaluable real-time information. A comprehensive overview of your environment's performance is provided. Let's delve into what you can expect to find:

Client Connections and Requests
Stay informed about the current number of client connections and the volume of requests being processed by your environment in real-time. This insight helps you gauge the level of activity and monitor the responsiveness of your system to incoming requests.
Cache Hit & Miss
Track the efficiency of your caching mechanisms by monitoring the ratio of cache hits to cache misses. This data allows you to assess the effectiveness of caching strategies and optimize performance by reducing unnecessary resource consumption.
Sessions
Keep track of active user sessions within your environment, enabling you to monitor user engagement and identify potential issues such as session leaks or unusually high session counts.
Requests and Backend Requests
Gain visibility into the total number of requests being handled by your environment, as well as the subset of requests that are forwarded to backend servers. This information is crucial for understanding the workload distribution and optimizing resource allocation to meet performance requirements.
Body Bytes
Keep track of the size of the data being transferred between your environment and clients. Monitoring body bytes provides valuable insights into bandwidth usage and helps you optimize content delivery strategies to enhance performance and reduce latency.
Compression
Monitor the effectiveness of compression techniques applied to data transmission, such as gzip compression. Tracking compression metrics allows you to assess the impact of compression on bandwidth usage and overall system performance.
Backend Connections
Stay informed about the number of connections established between your environment and backend servers or services. Monitoring backend connections helps you manage resource utilization, identify potential bottlenecks and ensure optimal communication between components of your system.
Operations
Keep an eye on the total number of operations performed by your environment such as; client requests, cache hits or compression actions. Monitoring operations enables you to gauge system activity, identify performance hotspots and optimize resource allocation to meet demand efficiently.
Stack Item Locations on Map
Gain insights into the physical locations of stack items hosted within datacenters by viewing them on a map. This map visualization allows you to see where each stack item is hosted geographically, providing you with a clear understanding of the distribution of your infrastructure across different regions.