We are excited to announce the latest feature release on our cloud platform: The Availability Reporter. The Availability Reporter is a complementary extension to the Availability Monitor, which you might recall from our last blog post. The Availability Reporter provides you with insights on your website’s performance regarding availability and response times. All this information is gathered from multiple regions in the world.
The challenge
Running applications can be demanding. Not only are you tasked with making new additions, oftentimes you’re also expected to ensure operational reliability. In an ideal world, downtime wouldn’t exist, and maintenance would take less than a minute. Unfortunately, reality can be different.
When things do go wrong, information is key. How was the application performing just before the incident? Which HTTP response codes were present? Is there a bug in the code or should you contact your hosting partner? It is difficult to keep track of when an application goes down and when it comes back up. Our availability monitor has got you covered for that.
But as a digital agency professional or software integrator there are other challenges to tackle concerning the availability and performance of your applications. When an application goes offline you want to know why this happened, how many times that happened and what the total downtime for a given period of time is. You need some tools to dig into the problem to improve the performance and availability.
Additionally, you want to assure your customers that their application is running smoothly with the highest availability. But you don’t have the exact numbers to prove that you deliver on or above par. This makes it hard to report about the availability and the performance of your customers’ applications.
How do we solve this?
The Availability reporter shows detailed information about an application’s availability metrics, performance history, and a detailed availability check list. Our Availability Reporter can help with this by providing a detailed overview of the application’s uptime and downtime history, including the duration and frequency of each incident. In addition, the Availability Reporter can provide performance insights across multiple geographical regions.
With this information, you can take action to troubleshoot the root cause of downtime, mitigate, and ensure that your customers’ application will remain up.
Availability metrics
As soon as you land on the history page of your website’s URL, you’ll be greeted by tiles that showcase the most critical metrics. These metrics include the duration of your website’s uptime, the overall uptime percentage, and the duration of any snoozed and acknowledged downtime within your chosen timeframe. Not only does the history page display uptime metrics, but it also shows you the specific checks that are taken into account. By default, we monitor SSL, HTTP, and gateway checks to ensure that the reports show metrics that truly matter. Additionally, we offer the option for multi-region monitoring that spans across the entire globe. This feature provides even more comprehensive coverage for your website, allowing you to track its performance and reliability across different regions and time zones.

Convenient links allow you to quickly navigate directly to the URL or application within the DeltaBlue Cloud platform. Performance history The availability and performance of your website is presented in a clear and transparent manner. Within your selected timeframe, you can easily view the average response times for your website.

By analyzing these metrics, you can identify patterns and trends that provide valuable insights into your website’s performance. For example, if there is a daily peak in response times, it could indicate that a scheduled process is running in the background and consuming excessive resources.
These insights enable you to optimize your website’s performance, address any issues that may be impacting its availability, and provide your users with a seamless experience. With the DeltaBlue Cloud platform’s transparent monitoring and clear presentation of metrics, you can proactively manage your website’s performance and ensure its success in the long run.
Pro tip:
Zoom in to a specific timeframe by selecting it in the graph!
Multi region Within the history overview, you can view the performance and availability metrics of your website across different regions.

This offer some advantages: Enhanced Reliability: By monitoring an application from multiple regions, businesses can ensure that their application is accessible to users from different parts of the world, even if one region experiences downtime or connectivity issues. Improved Performance: Multi-region monitoring can also help identify performance issues that may be specific to certain regions. By identifying these issues, businesses can optimize their application’s performance to ensure a smooth user experience.
Individual checks A key feature of the Availability Reporter is that it shows the results for each individual check that is performed. This level of detail allows you to pinpoint the exact moment when an issue occurred which you can cross reference with your application logs. By analyzing each check’s results, you can identify the specific areas that require attention and take action to resolve any issues quickly and effectively.
Pro tip:
You can search for specific log entries in the LOGS tab in the DeltaBlue Cloud Platform.

How to use it?
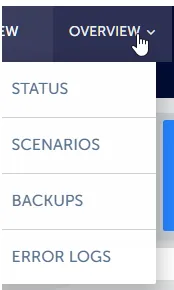
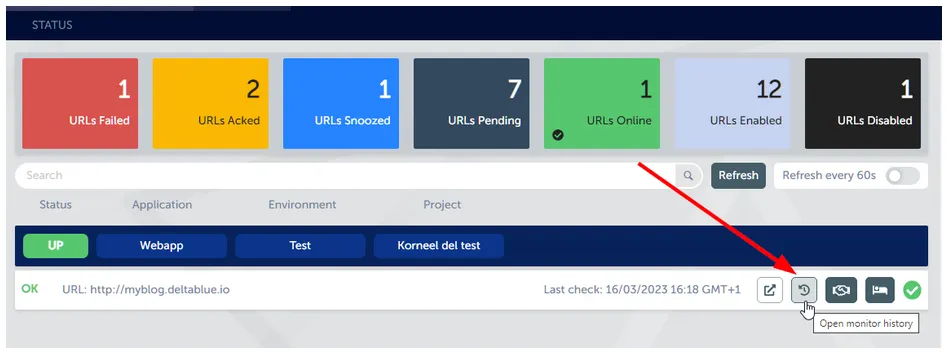
To access the Availability Reporter, navigate to the overview at the top and select “status”. This opens the availability monitor page.

From here, you can access the Availability Reporter via the history button for each URL and gain insights into its performance over time. With this information, you can identify trends and patterns, analyze specific events, and take proactive measures to optimize your website’s performance and ensure its availability.

Conclusion
The Availability Reporter is a powerful extension to the Availability Monitor which we covered in our last blog post.
It provides an effective solution to get better insights into the performance and availability of your applications. It is a convenient way on reporting the availability of your applications (SLA) to your customers.
By reviewing the behavior history of your applications, you can be more proactive towards the future. And… it comes at no additional charge!
We value the trust that our users give us every day! By being open and transparent, we prove that we’re worthy of your trust! We’re grateful for your continued commitment and support by using the DeltaBlue Cloud Platform.

